Dynamic images and dynamic text (infographics or "illustrations") can be created in Illustrate and then added to presentations or publications. The dynamic illustrations that were created in Illustrate can be driven by the values selected from slicers. This includes changing color, size, rotation, volume, showing or hiding, and, in the case of dynamic text, changing value.
Tip: You can use the Open in Illustrate option on the right-click context menu to open images or text fields that were created in Publish Pro, using Illustrate. Once open, you can manage their dynamic properties there and save them individually.
This topic describes how you can use dynamic output from Illustrate in publications. Other dynamic options exist that allow you to replace variables with information about your publication or pull data from matrix grids into text fields, and so on.
- Click here for more about dynamic assets
Configure dynamic assets
Before you begin
This topic is about integrating pre-existing dynamic infographics and text created in Illustrate into your publication. It assumes that these Illustrate files have been created in advance and made available for you to add to your publication from the Content panel.
- Click here for more information about dynamic images in Illustrate
- Click here for more information about dynamic text in Illustrate
Step 1: Add illustrations and slicers
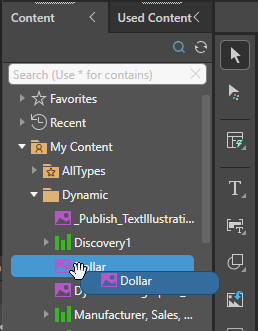
From the Content panel:
- Locate your Illustrate dynamic infographic or dynamic text item and drag it onto the canvas.
- Add a slicer that you want to affect your dynamic asset.
Note: The infographic used in this example was created following the method described in Example: Configure the Color Property in Building Dynamic Images. The dollar symbol changes color in response to the value of sales, changing to red where the value is below 200,000, green where it is above 400,000, and yellow otherwise.
For example, if you are adding an infographic that changes color based on sales, you might want to add a slicer that filters the sales by promotion category so that you can see the effect of changing that category on the color of this graphic.
Step 2: Create interactions
The dynamic asset and slicer are not connected by an interaction automatically. You need to create the interaction to make your selection from the slicer enable a response from the dynamic asset.
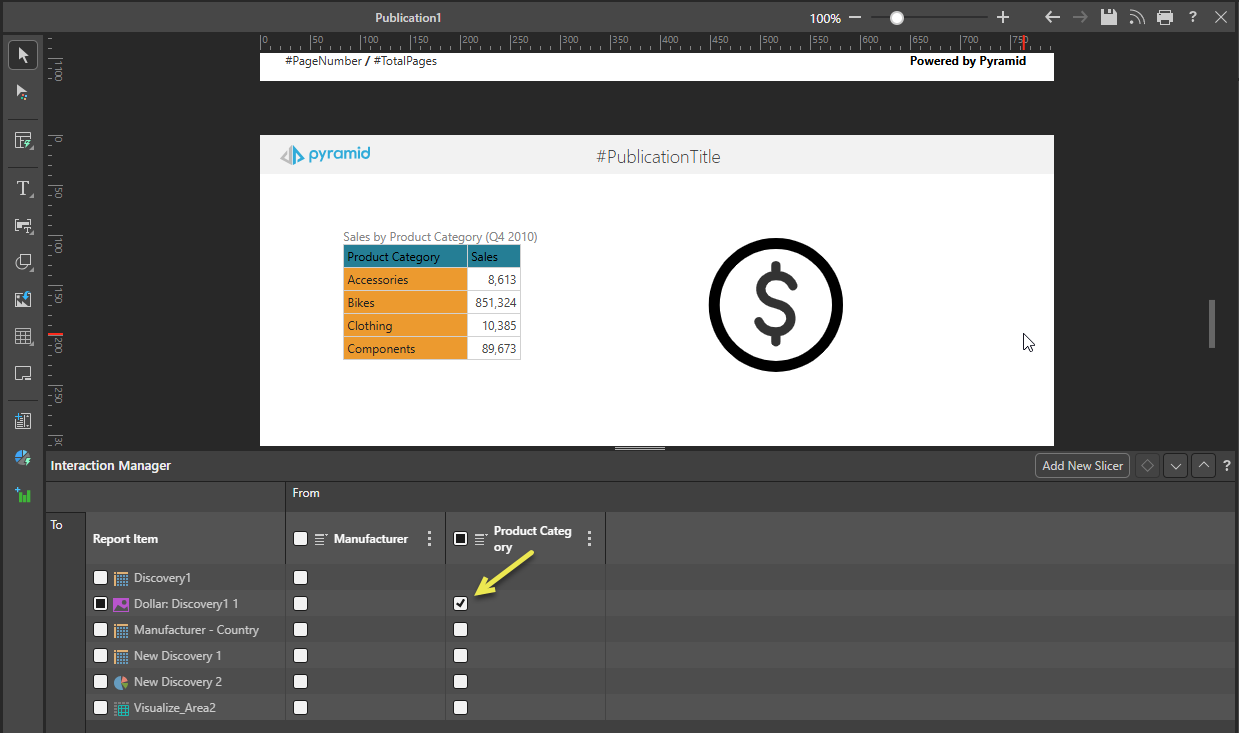
From the Interaction Manager:
- Select the checkbox at the intersection between the Slicer and the Dynamic Asset (yellow arrow below):
- Click F2 to build the publication with the following options:
- PDF.
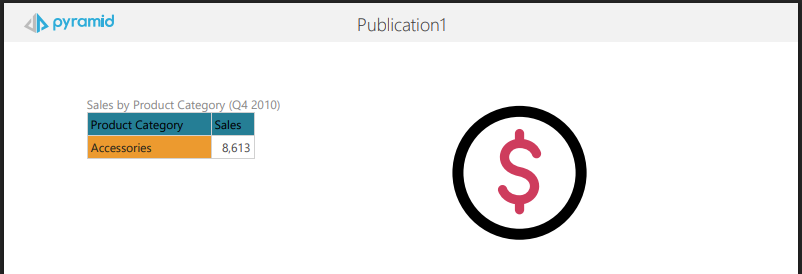
- Build 1: Select Accessories from the Product Category slicer.
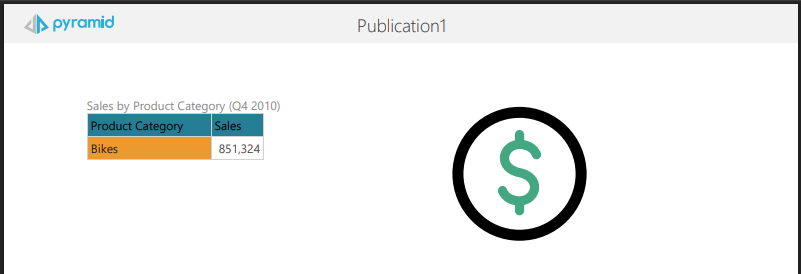
- Build 2: Select Bikes from the Product Category slicer.
The dollar symbol in our dynamic image will change color in response to the sliced value of sales.
The PDFs are built, and the dynamic Dollar symbol changes color to reflect the sliced sales value.
Note: We have added Discovery 1 to the canvas as well as the Dynamic Image. This helps you to see how the slicer affects the value in the Matrix Grid and how that in turn affects the image.
The first build filters Discovery 1 by Accessories. Since Accessories is a value below 200,000, the dollar symbol appears red in the output PDF:
The second build filters Discovery 1 by Bikes. Since Bikes is a value above 400,000, the dollar symbol appears green in the output PDF: